

What Everyone’s Getting Wrong About the Rise. You may have seen talk online that new home inventory is at its highest level since the crash.
So, you may not be getting the full story. A closer look at the data and a little expert insight can change your perspective completely.
Why This Isn’t Like 2008
While it’s true the number of new homes on the market hit its highest level since the crash, that’s not a reason to worry. That’s because new builds are just one piece of the puzzle. They don’t tell the full story of what’s happening today.
When you combine those two numbers, it’s clear overall supply looks very different today than it did around the crash (see graph below):
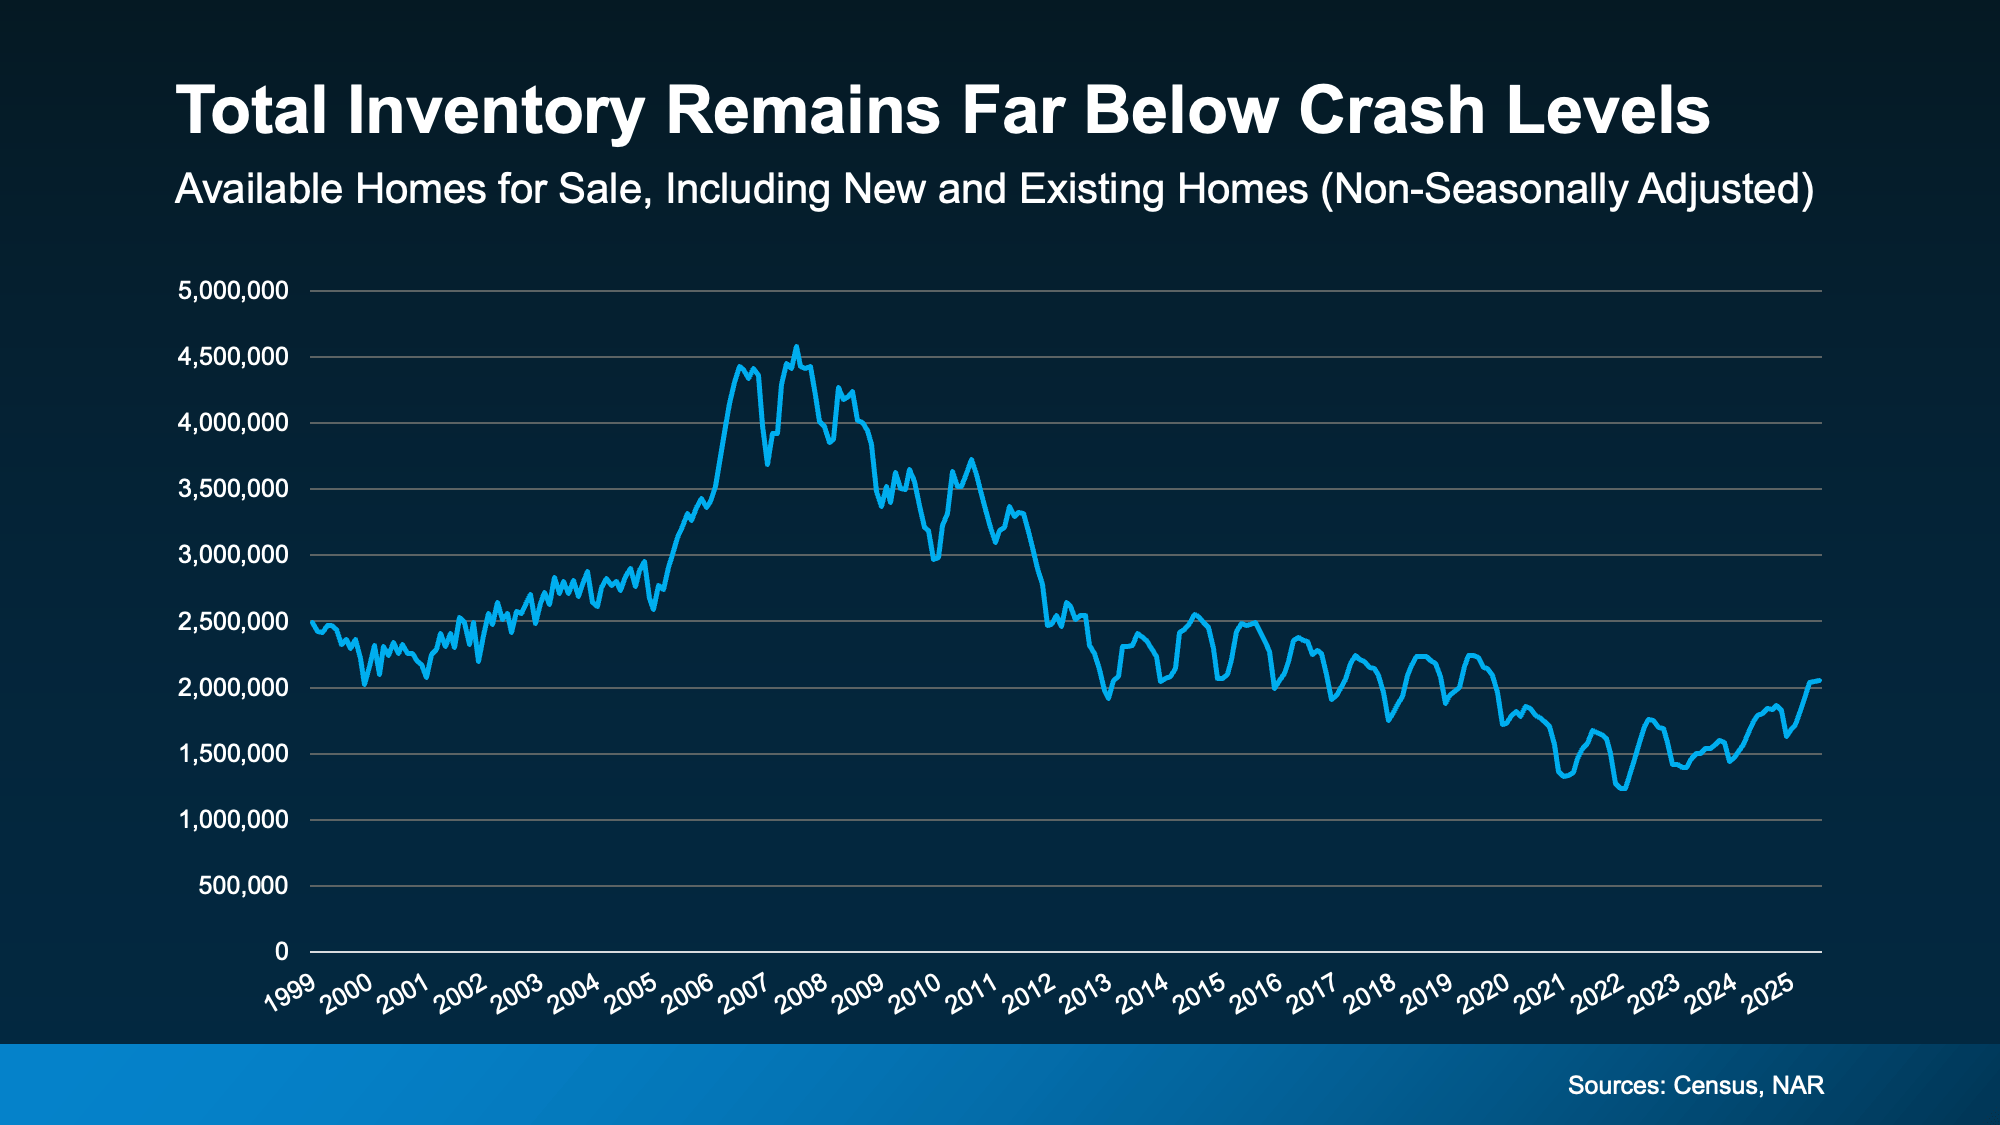 So, saying we’re near 2008 levels for new construction isn’t the same as the inventory surplus we did the last time.
Builders Have Actually Underbuilt for Over a Decade
And here’s some other important perspective you’re not going to get from those headlines. After the 2008 crash, builders slammed on the brakes. For 15 years, they didn’t build enough homes to keep up with demand. That long stretch of underbuilding created a major housing shortage, which we’re still dealing with today.
The graph below uses Census data to show the overbuilding leading up to the crash (in red), and the period of underbuilding that followed (in orange):
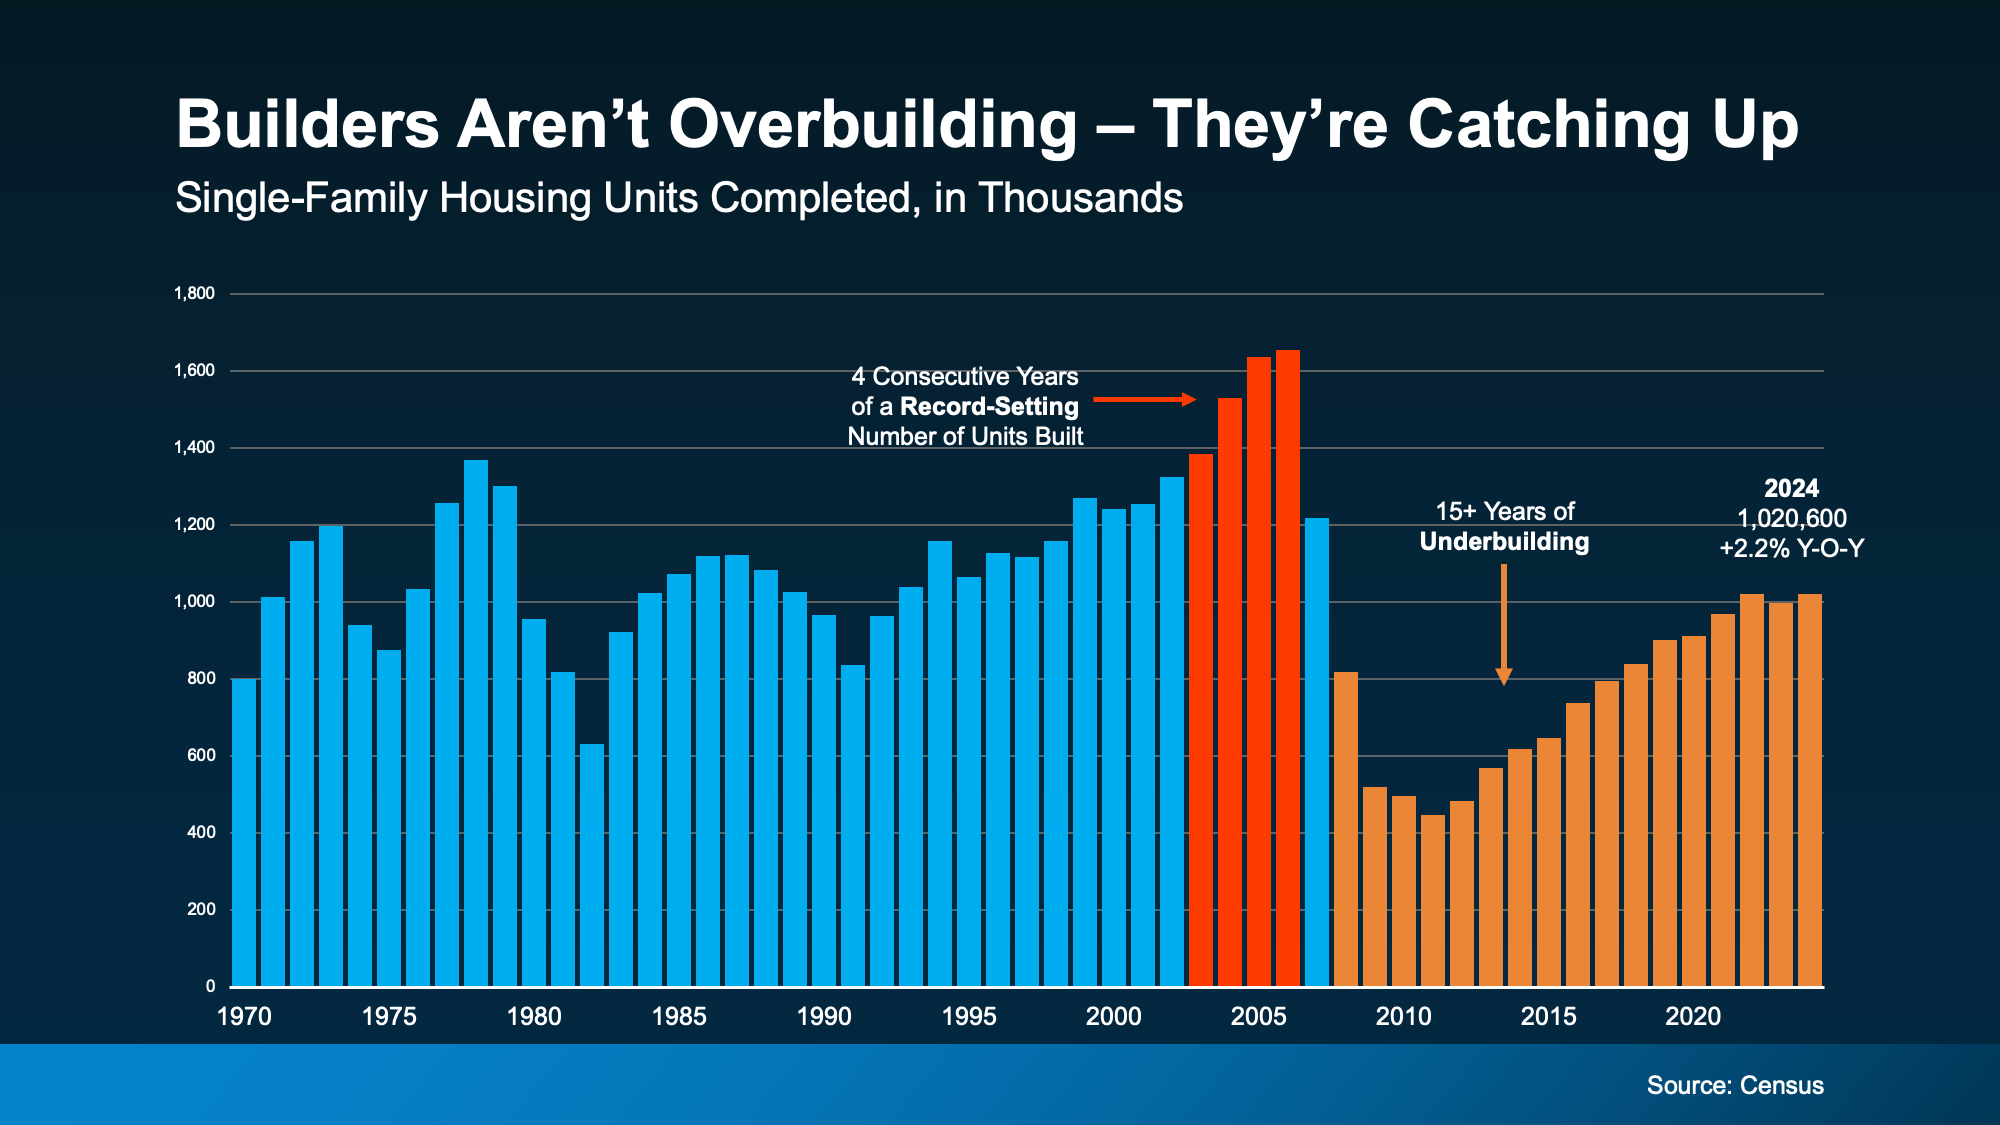 Basically, we had more than 15 straight years of underbuilding – and we’re only recently starting to slowly climb out of that hole. But there’s still a long way to go (even with the growth we’ve seen lately). Experts at Realtor.com say it would roughly 7.5 years to build enough homes to close the gap.
Of course, like anything else in real estate, the level of supply and demand is going to vary by market. Some markets may have more homes for sale, some less. But nationally, this isn’t like the last time.